
Click to make BIG
From Pittsburgh City Archives, a good twitter follow.
Map of Pittsburgh’s Major Street System, a part of @PLANPGH Master Plan in 1941. pic.twitter.com/lJr31ew2qX
— Pittsburgh City Archives (@PghArchives) October 11, 2018
Click to make BIG
From Pittsburgh City Archives, a good twitter follow.
Map of Pittsburgh’s Major Street System, a part of @PLANPGH Master Plan in 1941. pic.twitter.com/lJr31ew2qX
— Pittsburgh City Archives (@PghArchives) October 11, 2018
Speed Kills, dawg.
The map is pretty self-explanitory.
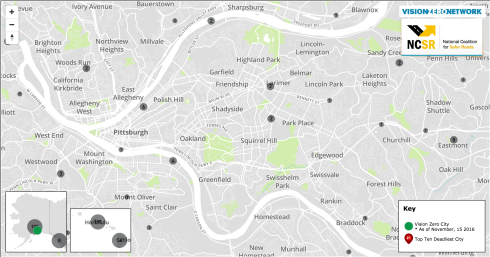
Click to see it on the National Coalition for Safer Roads site
The 10 Cities with the most speed-related fatal crashes

Sixteen of Pa’s 334 most hazardous roads are in Allegheny County.
Penn Ave in Point Breeze = Pennsylvania’s 11th-most hazardous roadway.
Good job PennDOT!
Click to read the full article in the Pittsburgh Tribune Review

Much of the text is boiled down from the original post. I tried to get rid of the boring stuff.
This is a DEM of the city of Pittsburgh. It is more towards the north western side of the city. The size of the DEM is roughly 43,797,080 square meters or 43.79708 square kilometers. Each pixel is 10 meters by ten meters or 100 meters squared. This makes the resolution of the map close to 437,970 pixels. The elevation ranges fron a low of 218.2 feet to a high of 381.83 feet.
The colors go from red for low elevation to blue for higher elevations. Red turns to orange which turns to yellow, which turns to a whiteist color, then a light blue, and finally the dark blue that represent the highest elevations. Several things you can notice are the low elevations where the rivers are. You can also see how some streams and waterflow divert based on the low elevations and knowing the behavior of the rivers. The map also shows how the elevation rises fairly quickly beside the water. These are the hills of Pittsburgh the line the rivers. The city itself is situated in an area that is fairly level. You can also see how the low river goes around a higher elevation to the north west of the map. This is one of the islands along the river.

The lines shown in this vector layer are brown for hydrography, blue for railroads, green for roads, and blue backgrounds for urban areas. The colors used were chosen because they are neat and easy on the eye to represent the most prominent features of the map. From the map you can determine that Pittsburgh does not follow the standard grid roadway system used in many cities. The roads seem to go along and fit the odd shape of the land surrounding them. From the Image you can see the many bridges that cross the rivers. You can also see the train systems that run through the city and follow the rivers. You can mostly see how the city was built around the rivers and the land it is on. Little ponds can be seen as brown circles on the map. It is interesting to note you can identify a park area because of the pond and the lack of roads that cut through it. The road that used to circle three rivers stadium is also in the map. One last thing the map shows is how the rivers and woods (not shown) are not represented by the blue background color.

The relationship between land formations roadways railroads, and hydrography all go hand in hand. The roads follow the contours of the hills and go along certain ridges. This can be because if roads went any which way they would be too steep. It is also easy to see how the river at one point branches off into a smaller water way along a low elevation. Railroads on the map stay on the flattest possible elevation, which tends to be close to the rivers.
Thanks for letting me steal your post. You pretty much summed it up.
