Fantastic! Fascinating! Sad! Enlightening!
This has been making the rounds on the internet, but it’s definitely worth digging in to. This is bigly important in understanding institutional racism, classism, and xenophobia.
I’ll just let the creators of the map and website explain:
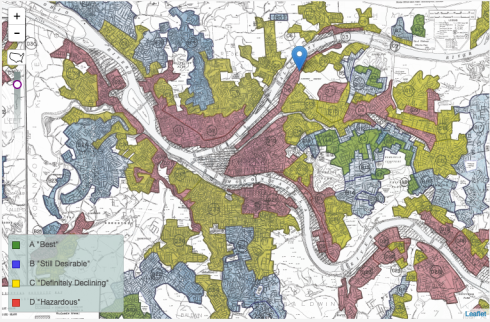
Mapping Inequality updates the study of New Deal America, the federal government, housing, and inequality for the twenty-first century. It offers unprecedented online access to the national collection of “security maps” and area descriptions produced between 1935 and 1940 by one of the New Deal’s most important agencies, the Home Owners’ Loan Corporation or HOLC (pronounced “holk”).
HOLC recruited mortgage lenders, developers, and real estate appraisers in nearly 250 cities to create maps that color-coded credit worthiness and risk on neighborhood and metropolitan levels. These maps and their accompanying documentation helped set the rules for nearly a century of real estate practice…
Through offering a digital library of the state’s role in housing development, Mapping Inequality illustrates vividly the interplay between racism, administrative culture, economics, and the built environment.
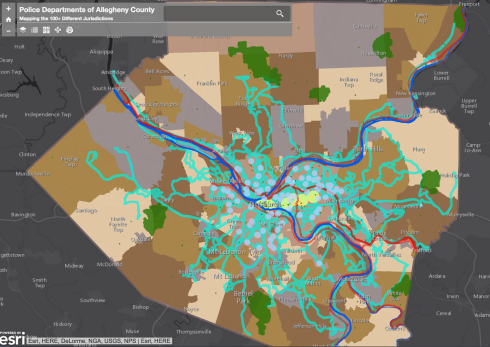
Check out Pittsburgh’s map here
Tags: classism, economics, government, history, housing, inequality, interactive, racism, urban design, xenophobia